Lead efficiency
Which lead converts, when, on which channel. Not an average — the real journey, lead by lead.
CCaaS says one thing. CRM says another. Quality, another one still. Your Monday mornings go into cross-checking exports instead of deciding.
The real problem
Every tool in your stack computes its own version of the same number. The contact center's resolution rate isn't the CRM's. Quality's volume isn't the executive report's. You don't waste time finding the information. You waste time deciding which version to trust.
?
→
Ticket by ticket
Most reporting tools store counts: number of calls, average handle time, resolution rate. Aggregated numbers, computed once, frozen. Ask a question they didn't plan for, and the answer doesn't exist — you ask IT, and you wait.
BI & Analytics doesn't store counts. It stores every interaction as a complete ticket: calling number, called number, transfers, keys pressed in the IVR, CRM data pulled during the call, the length of every break. The full detail. Not its summary.
Direct consequence: every question becomes askable, including the ones nobody saw coming.
The platform covers voice and omnichannel — chat, WhatsApp, email. AI agents connect through a simple webhook: their conversations become tickets, the same way your human agents' do. One data model, whoever — human or AI — ran the conversation.
Four pillars
CCaaS, CRM, quality, AI agents. One single base. Not six exports to stitch back together.
The agent sees their own numbers. The supervisor, their team. Leadership, the whole operation.
Dashboards from day one. Or build your own, without writing a line of code.
Thresholds. Alerts. Before the drift turns into a problem.
Pillar 1
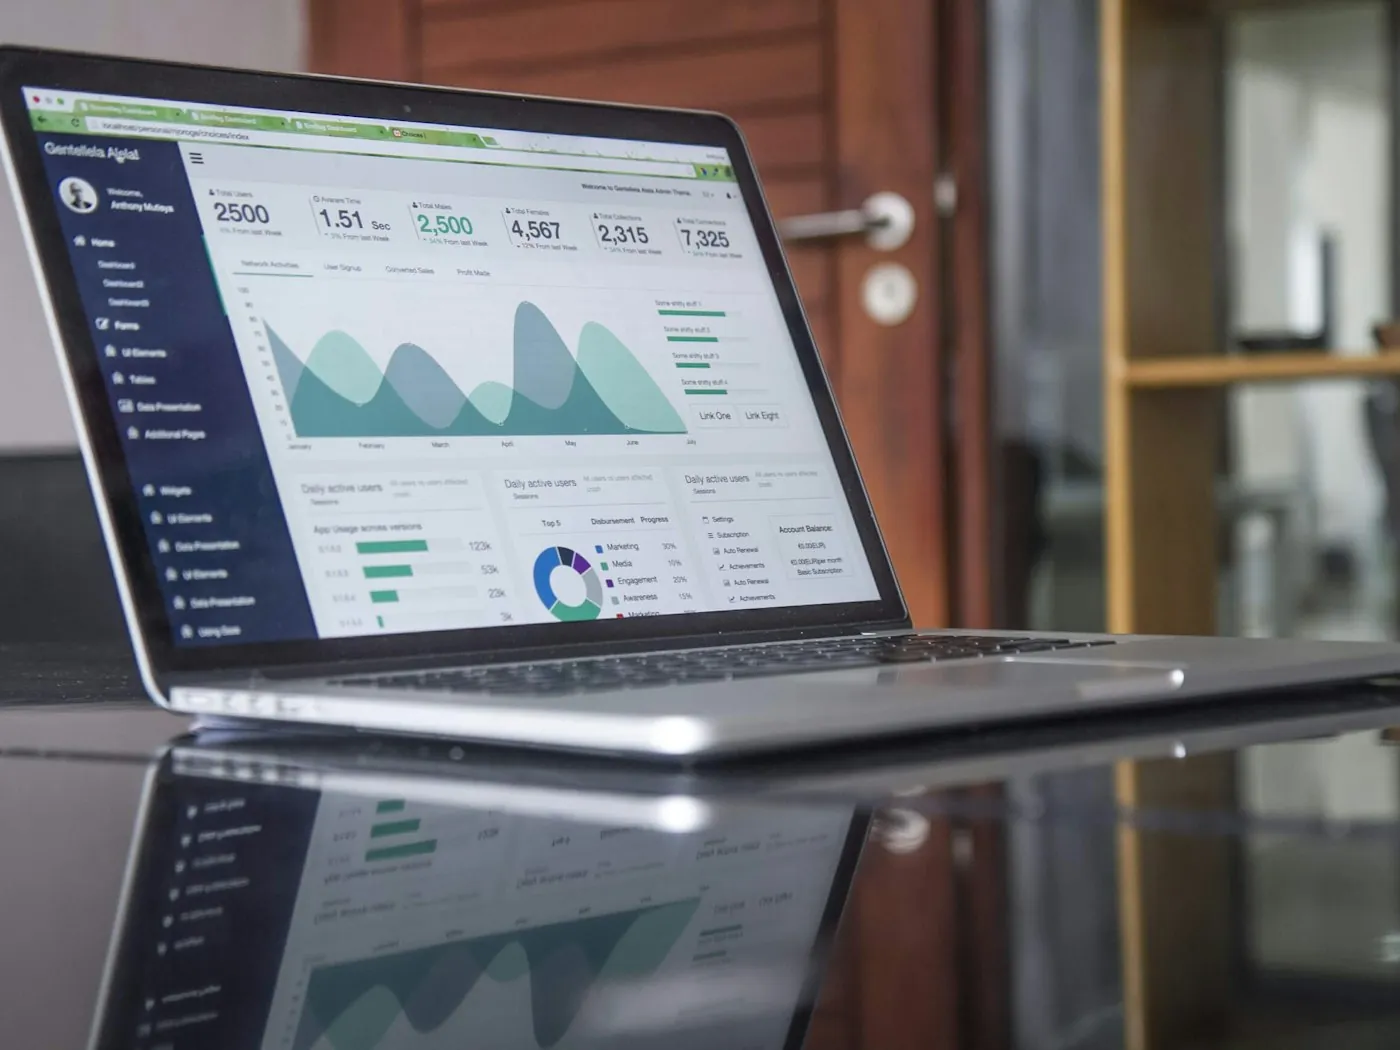
Your contact center, your CRM, your quality tool, your AI agents: each produces its own data, on its own island. BI & Analytics brings it all into one base, updated continuously.
No more Monday-morning ritual. Three exports, one spreadsheet, an hour lost forcing three different files to agree with each other.

Pillar 2
An agent doesn't need the center's overall performance. A director doesn't need conversation-by-conversation detail. Everyone sees what concerns them, at their level, without drowning in the rest.
Same data underneath. Different view on top. An agent improving, a supervisor running their queue, leadership deciding — on the same numbers, never on different versions of them.
Pillar 3
Dashboards built to start on day one: volumes, resolution, satisfaction, AI agent performance. Nothing to configure to see what matters.
Need a view nobody planned for? Build it yourself. No ticket, no developer, no waiting for the next IT sprint.
Pillar 4
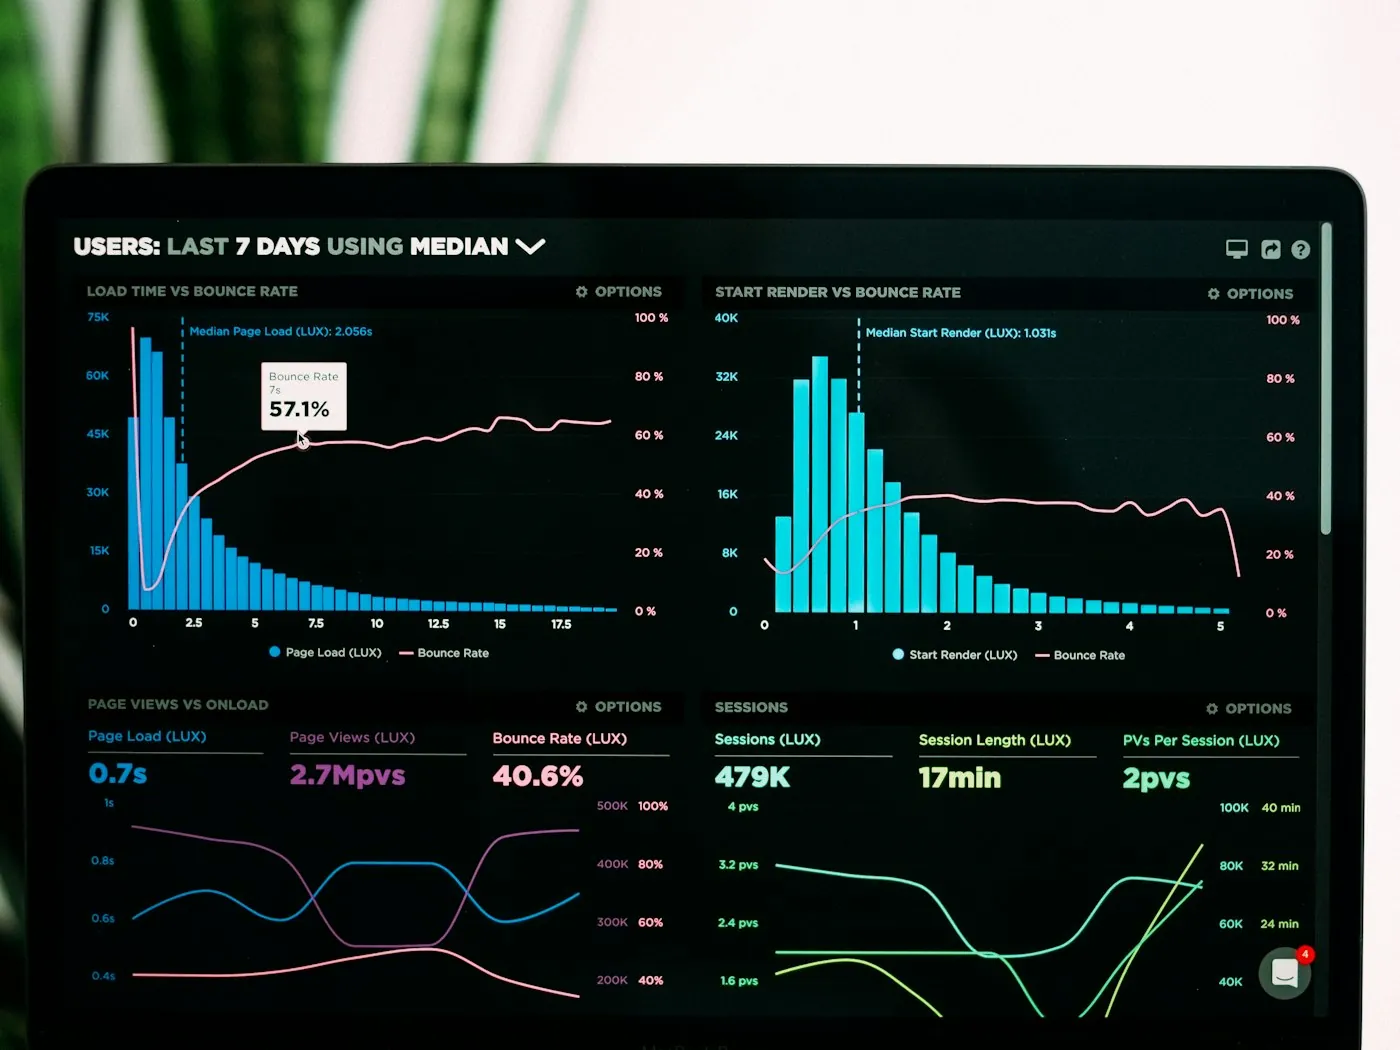
A wait time that's creeping up. An escalation rate drifting off course. A quality score dropping on one campaign. BI & Analytics doesn't just display it. It alerts you.
Combined with Auto QM and AI agent governance, this same data layer becomes the watchtower over your whole operation — not a dashboard you check once a week.
See Quality MonitoringNext to Quality Monitoring
Quality Monitoring analyzes what's said: the content of the conversation, scored against your scorecard. BI & Analytics traces what happens around it: the calling number, the called number, transfers, IVR keypresses, CRM data pulled during the call, break duration.
Content on one side. Context on the other. Together, they cover the whole conversation — what was said, and everything around it.
See Quality MonitoringShared, not locked away
Frequently asked questions
BI & Analytics is native on Vocalcom. On a third-party platform, the connection runs through an API, and depends on what that platform exposes. We'll tell you plainly, before any commitment, what's possible for you.
Yes. BI & Analytics isn't meant to replace your leadership's choice of tool. It removes the manual exports upstream, and can feed whatever tool you already use downstream.
No. Views are built without code. A developer only steps in for very specific needs, outside the standard framework.
You choose where it's hosted, based on your obligations and your clients'. The platform runs on the same certifications as the rest of Vocalcom: ISO 27001, PCI-DSS, SOC 2 Type II.
No. Data informs, it doesn't decide. Same logic as our AI agent governance: the system illuminates, the human calls the shot.
Ready-made dashboards are visible as soon as your sources are connected. Custom views take more or less time depending on complexity — we'll tell you during the demo, on your own case.
Every billable interaction is traced with its full context. That's what makes per-interaction billing defensible — the ticket-by-ticket evidence to build your invoicing on. It's not a billing tool itself — it's what your billing rests on.
Bring your current exports — CCaaS, CRM, quality. We'll show you live what a single dashboard changes.